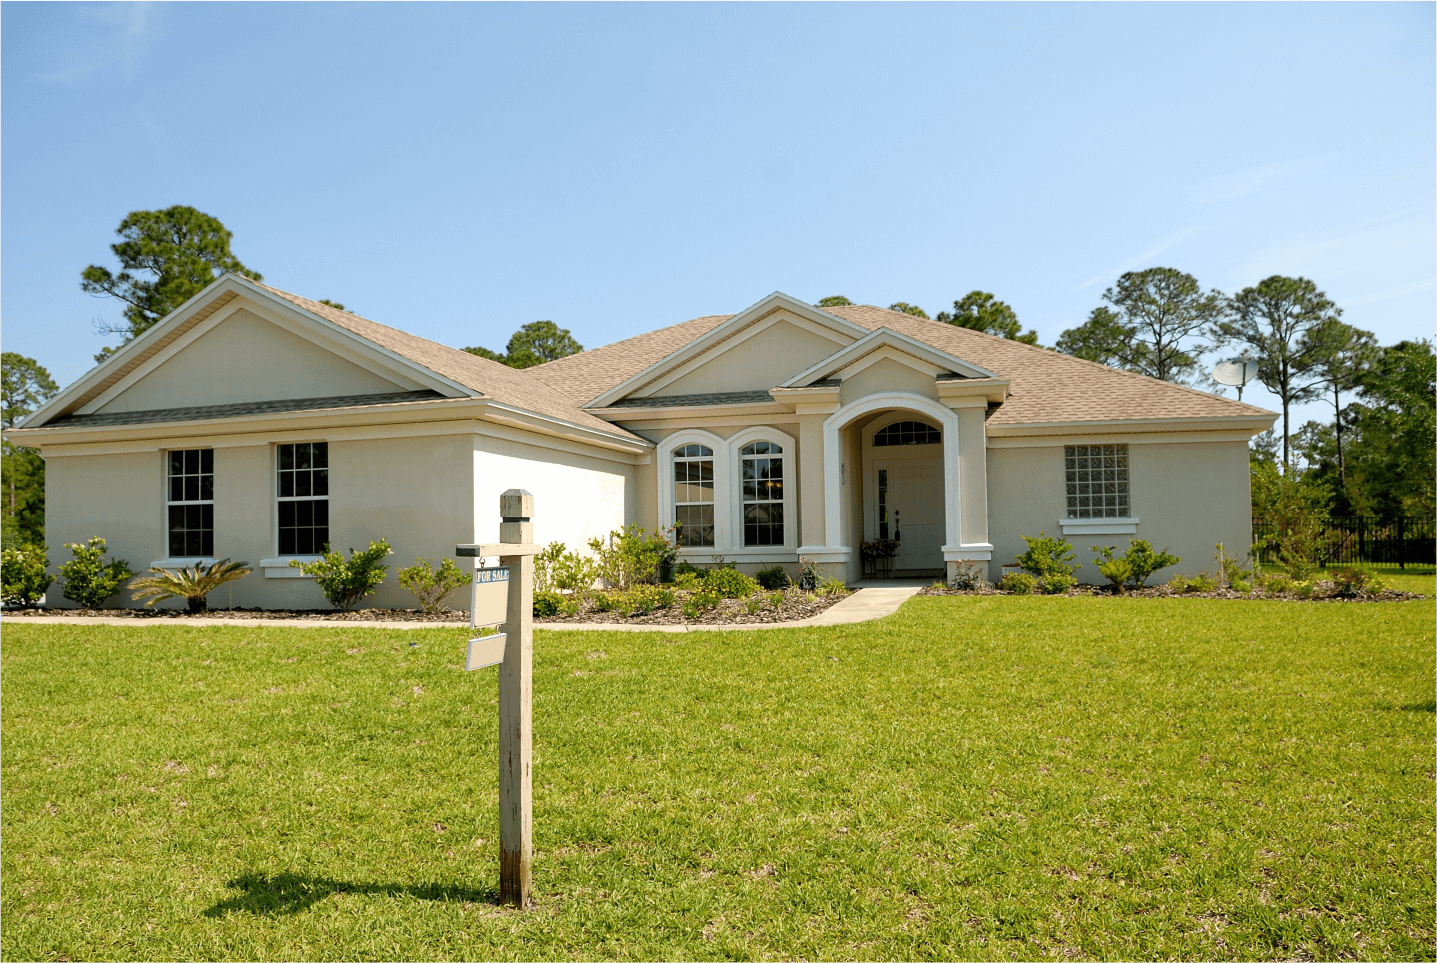
First Fidelity Home Mortgage of Wisconsin, LLC works with homeowners across the state to evaluate how their equity position fits into their broader financial picture. Below is a detailed example — built on current market rates and Wisconsin-specific housing data — illustrating how equity can be used to consolidate high-interest debt and acquire an investment property, without materially increasing monthly obligations.
As a licensed mortgage brokerage, First Fidelity compares pricing across a network of investors rather than offering a single lender's rate sheet. The figures below are illustrative and intended to demonstrate the mechanics of this strategy; actual terms depend on the borrower's credit profile, income, equity position, and the specific investor selected during the loan process.
Baseline monthly obligation: $2,405/month.
A cash-out refinance replaces the existing first mortgage with a new, larger loan and disburses the difference in cash.
At a representative rate of 6.75% on a new $375,000 loan (75% loan-to-value), the resulting payment is approximately $2,433/month. After retiring the existing mortgage balance, the $35,000 in consumer debt, and closing costs, approximately $82,000 remains available.
That amount, applied as a 25% down payment, supports the acquisition of a $325,000 investment property financed through a DSCR loan — a program that qualifies the borrower based on the subject property's projected rental income rather than personal income documentation. At a representative DSCR rate of 7.25%, the resulting investment property payment (including estimated taxes and insurance) is approximately $1,964/month, against an estimated market rent of $2,050/month.
Net result: The increase in the primary mortgage payment is nearly offset by the elimination of consumer debt payments, resulting in a net monthly change of approximately +$28. The investment property operates as a self-sustaining asset.
When a homeowner's existing first mortgage rate is below current market rates — as in this example, at 4.25% — a second mortgage often preserves more favorable overall economics than a full cash-out refinance, since the original loan's rate and balance remain untouched.
A second mortgage of $122,000 (covering debt payoff, the down payment, and closing costs) at a representative rate of 7.35% amortized over 20 years produces a payment of approximately $972/month.
Net result:
Total monthly obligation: $2,327/month — a net decrease of approximately $78/month relative to the starting position, while retiring $35,000 in consumer debt and acquiring a second income-producing asset.
| Metric | Cash-Out Refinance | Second Mortgage |
|---|---|---|
| Rate applied to original $250,000 | 6.75% (reset) | 4.25% (unchanged) |
| Net monthly change | +$28 | –$78 |
| Assets held after transaction | Primary residence + investment property | Primary residence + investment property |
Generally, a cash-out refinance is more advantageous when the borrower's existing rate exceeds current market pricing. A second mortgage tends to be more advantageous when the existing rate is below market, as it preserves the lower rate on the larger, existing balance.
Using Wisconsin REALTORS® Association data — which has reported statewide median price growth as high as 7.9% year-over-year in early 2026 — alongside more conservative long-term appreciation forecasts, this projection applies a 4% annual appreciation assumption. Rent growth is projected at 3% annually, consistent with Wisconsin's approximately 15-year compound annual growth rate for Fair Market Rent.
Applied to Financing Structure B over five years:
| Metric | Today | Year 5 |
|---|---|---|
| Primary residence value | $500,000 | $608,326 |
| Investment property value | $325,000 | $395,405 |
| Monthly rental income | $2,050 | $2,376 |
| Investment property net cash flow | +$86/month | +$412/month |
Combined appreciation across both properties over the five-year period is approximately $178,700, in addition to principal reduction on both mortgage balances and the elimination of an estimated $35,000 in high-interest consumer debt.
Every homeowner's equity position, credit profile, and local rental market differ. To evaluate whether this strategy applies to your specific situation, contact First Fidelity Home Mortgage of Wisconsin, LLC, to have a Mortgage Loan Originator review your options across our investor network.
This case study is for illustrative and educational purposes only. It does not constitute a loan offer, rate lock, or guarantee of approval. Rates, terms, and program availability are subject to change and depend on individual borrower qualification, including credit, income, equity, and investor-specific guidelines. Rental income projections and appreciation estimates are based on historical and current market data and are not guaranteed. First Fidelity Home Mortgage of Wisconsin, LLC | NMLS #279615 | Equal Housing Opportunity.